Reality Check my Route
Plan rides you won't regret. Difficulty, time, energy, and climate data for touring, gravel, and mountain routes.
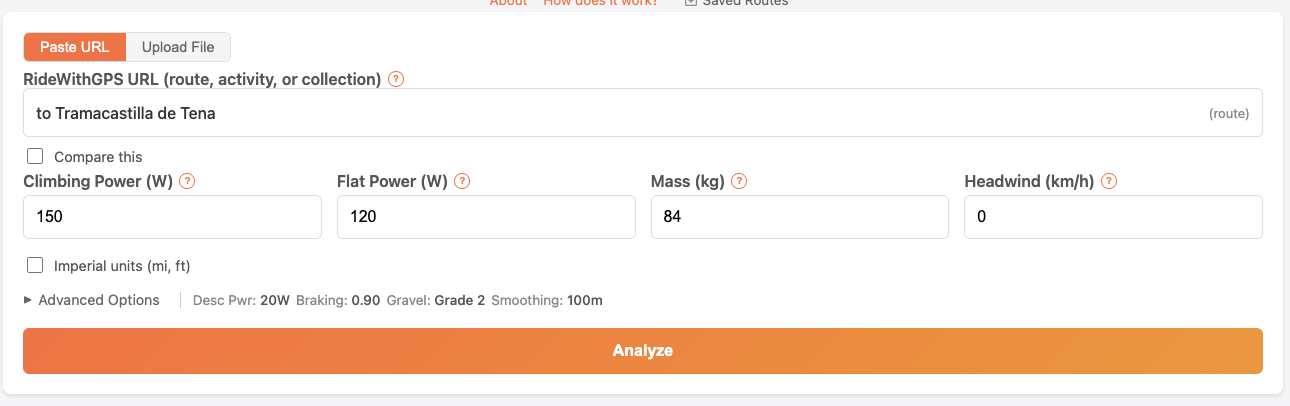
Route Analysis
You give it a route and a few numbers — your weight, how hard you pedal uphill, how hard you pedal on flats. It solves the power-balance equation at every GPS point and tells you how long the ride takes, how much work you'll do, and where the hard parts are.
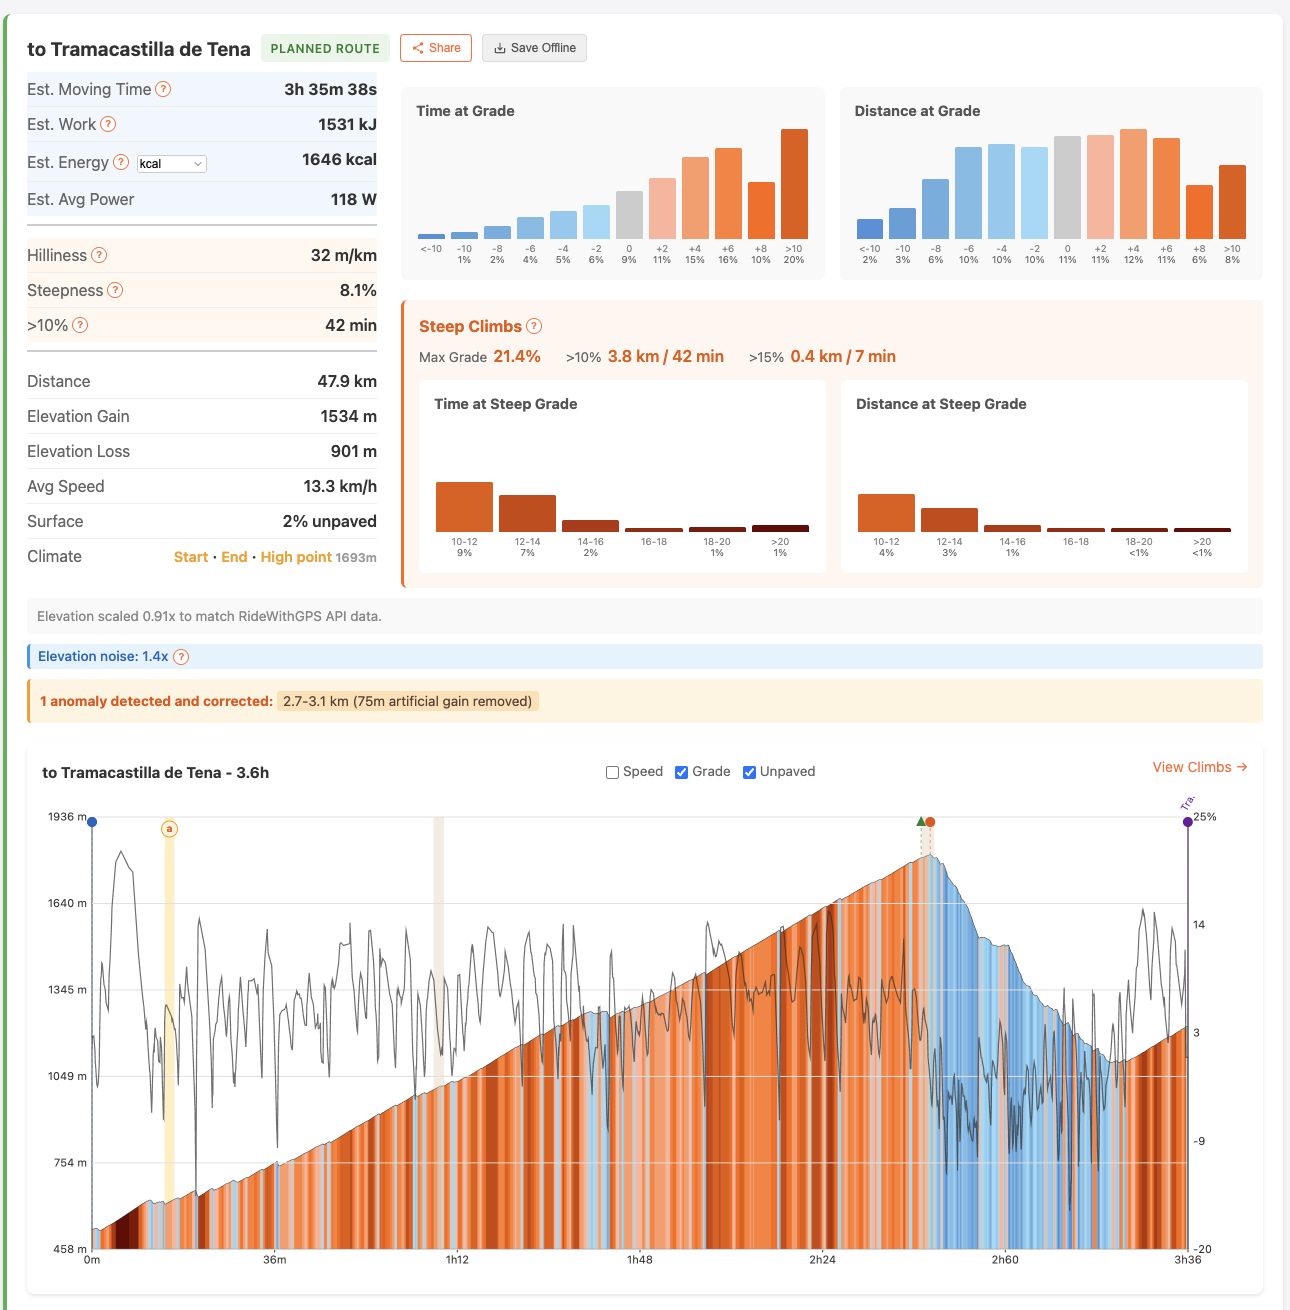
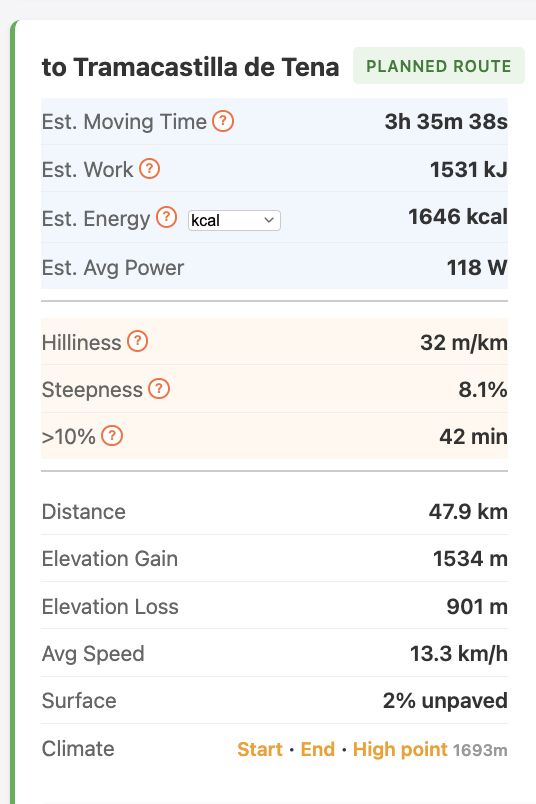
Example: Laruns to Tramacastilla via Col du Pourtalet
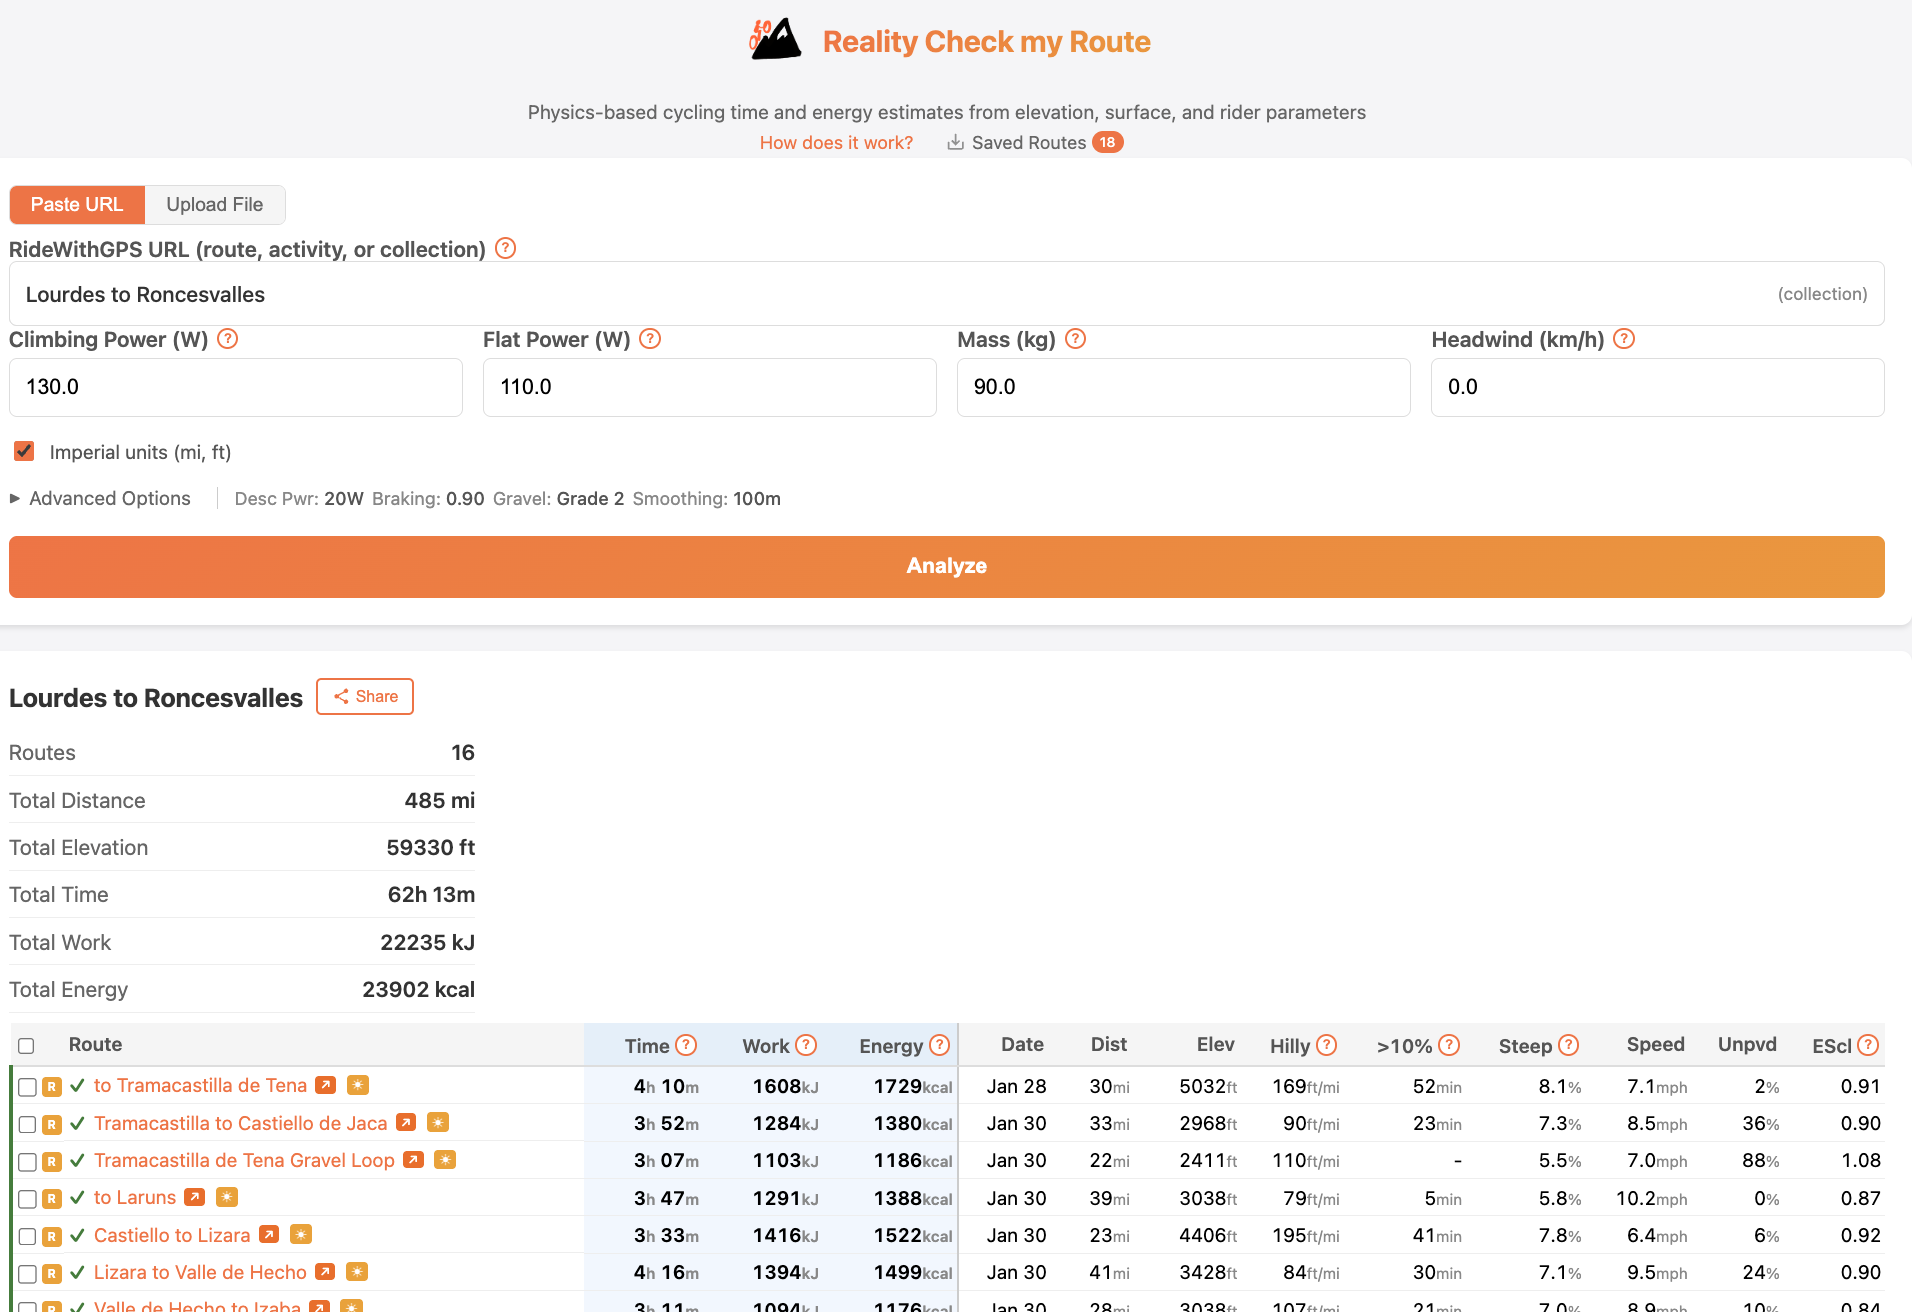
Multi-day Planning
Paste a RideWithGPS collection and it analyzes every route. Sortable table with time, work, elevation, hilliness, steepness — so you can spot the day that's going to destroy you before it does.
Example: Lourdes to Roncesvalles
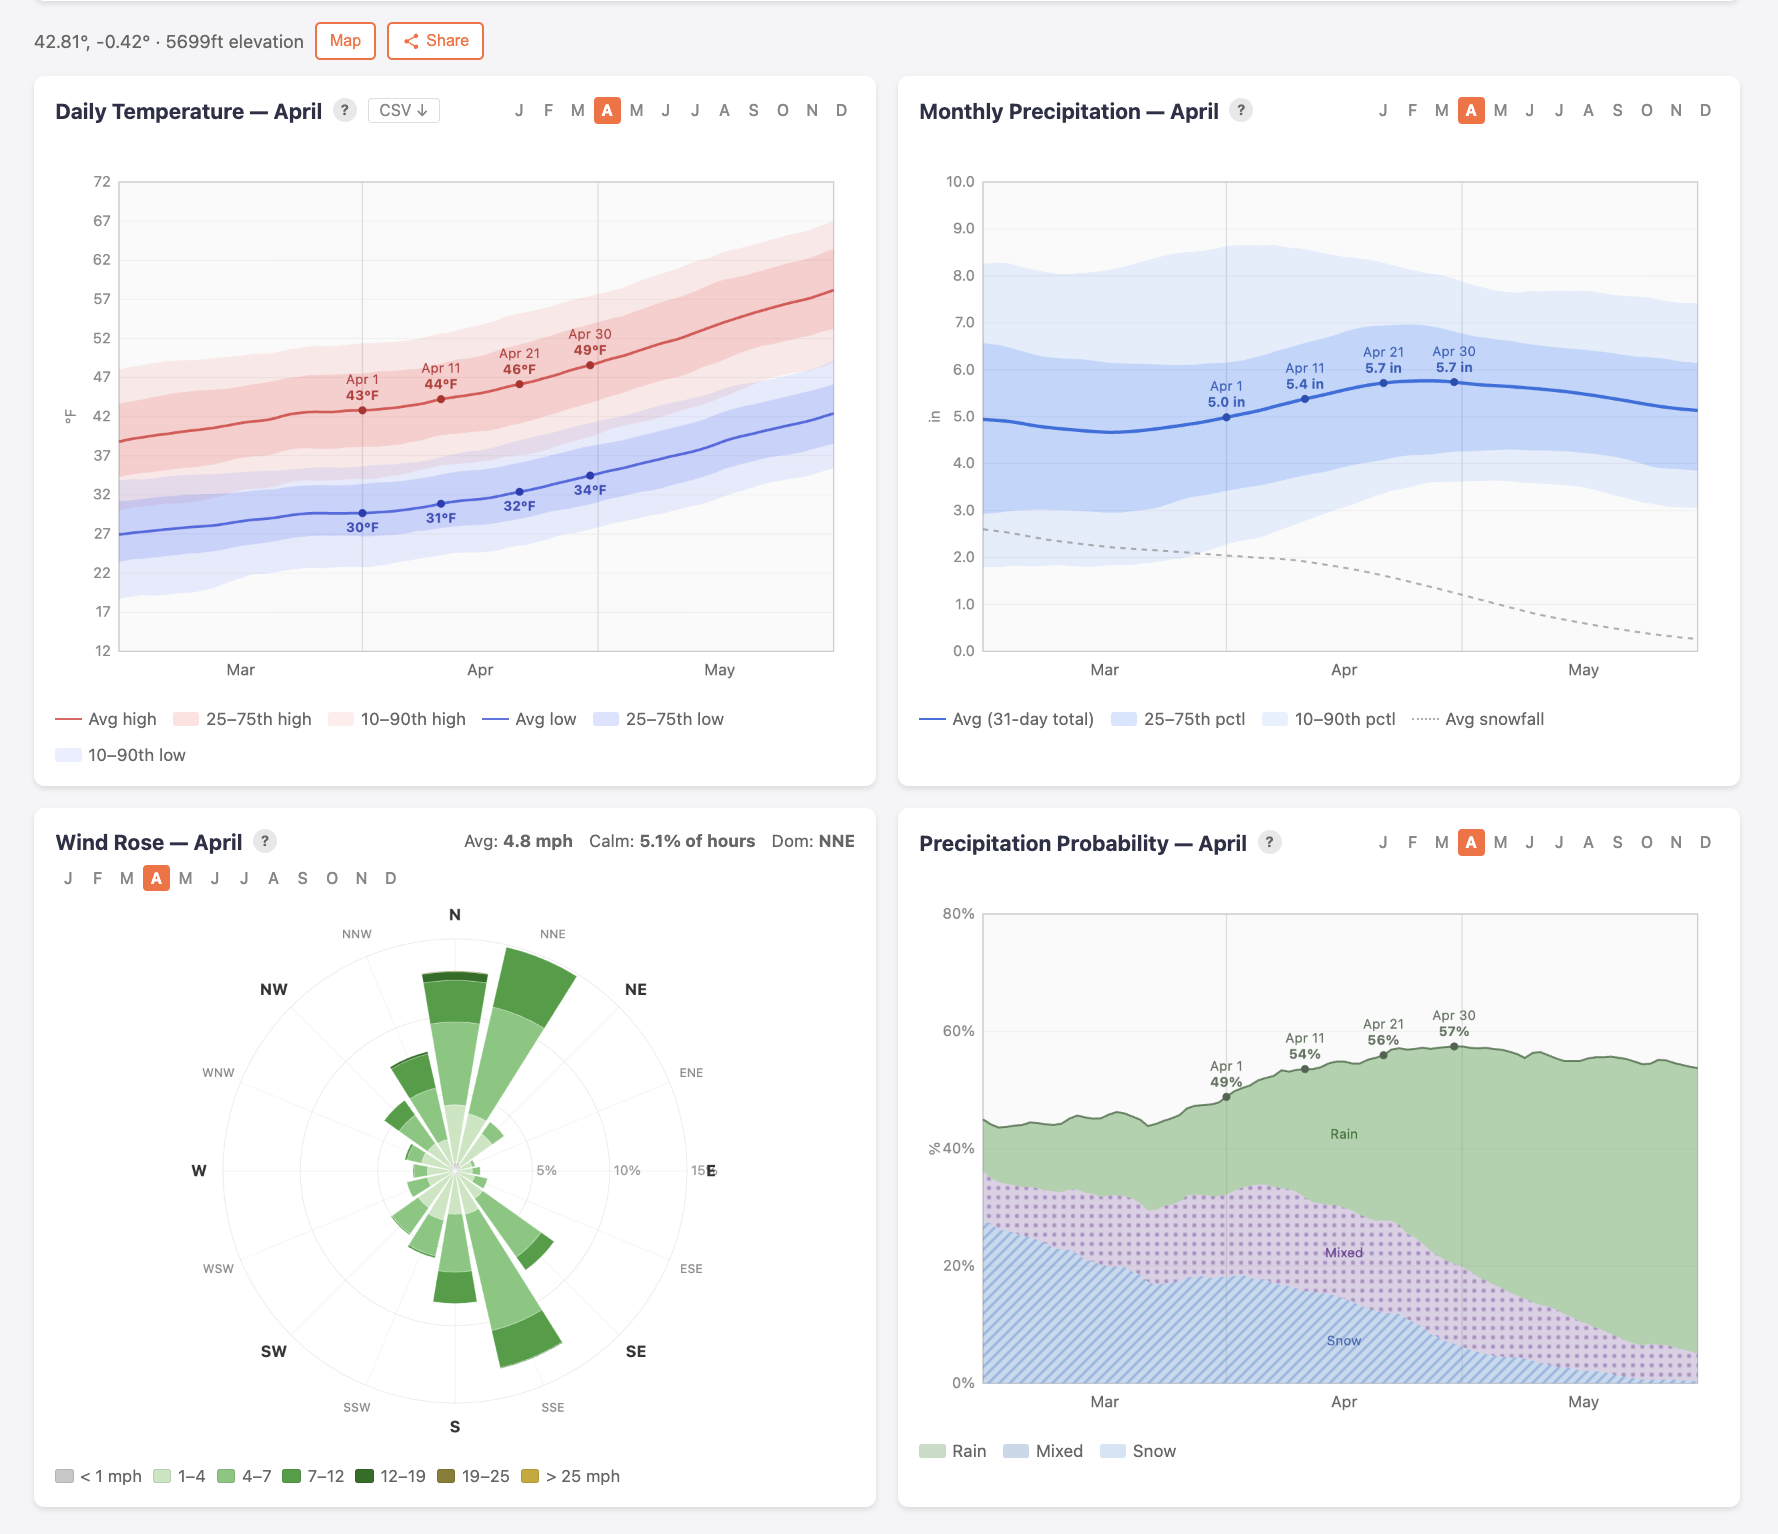
Climate
Historical weather for any location. Temperature bands, precipitation probability (rain vs snow vs mixed), wind rose. 30+ years of daily records. Useful for figuring out whether that April pass crossing needs a rain jacket or full winter kit.
Example: Col du Pourtalet in April
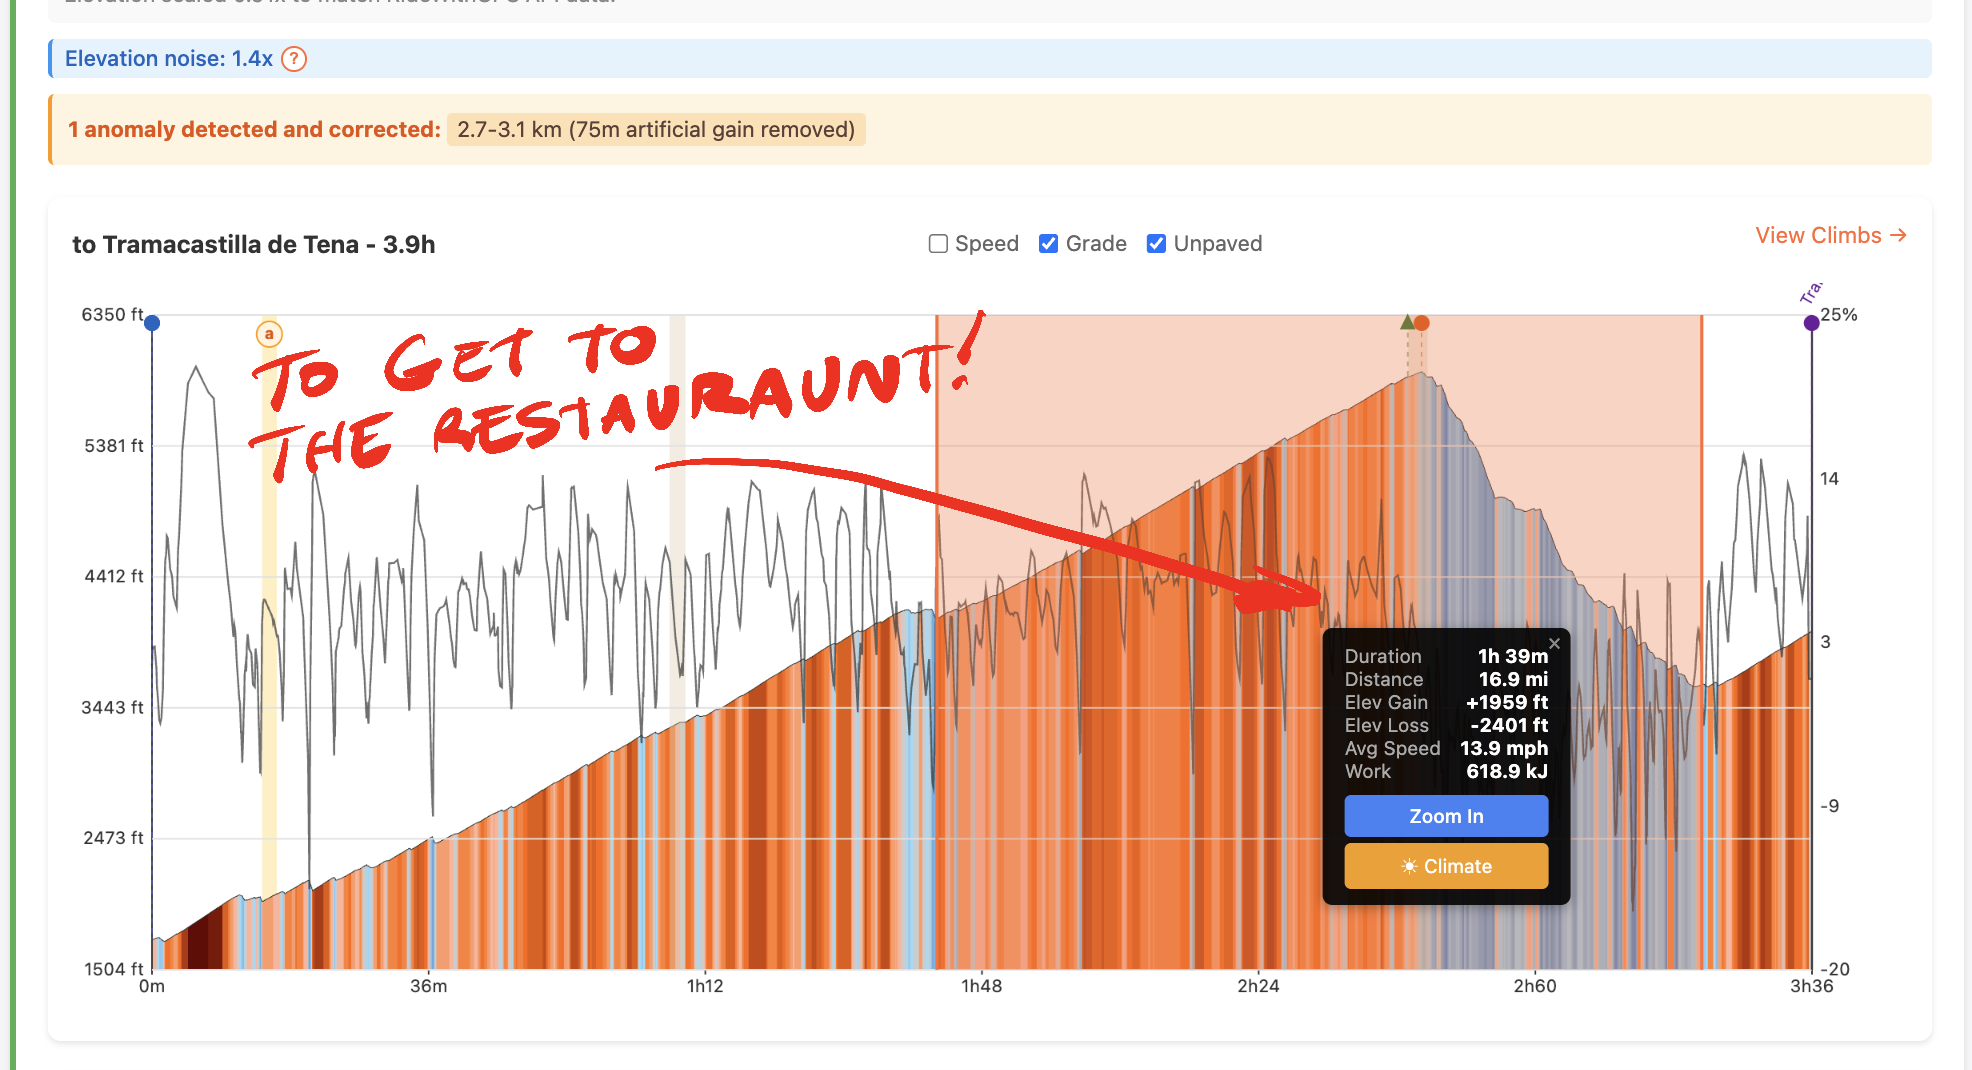
On the Ride
Click-drag any segment of the elevation profile to see time, distance, gain, and work remaining to a point ahead. Built to answer: how much longer to the bakery on the other side of this mountain?
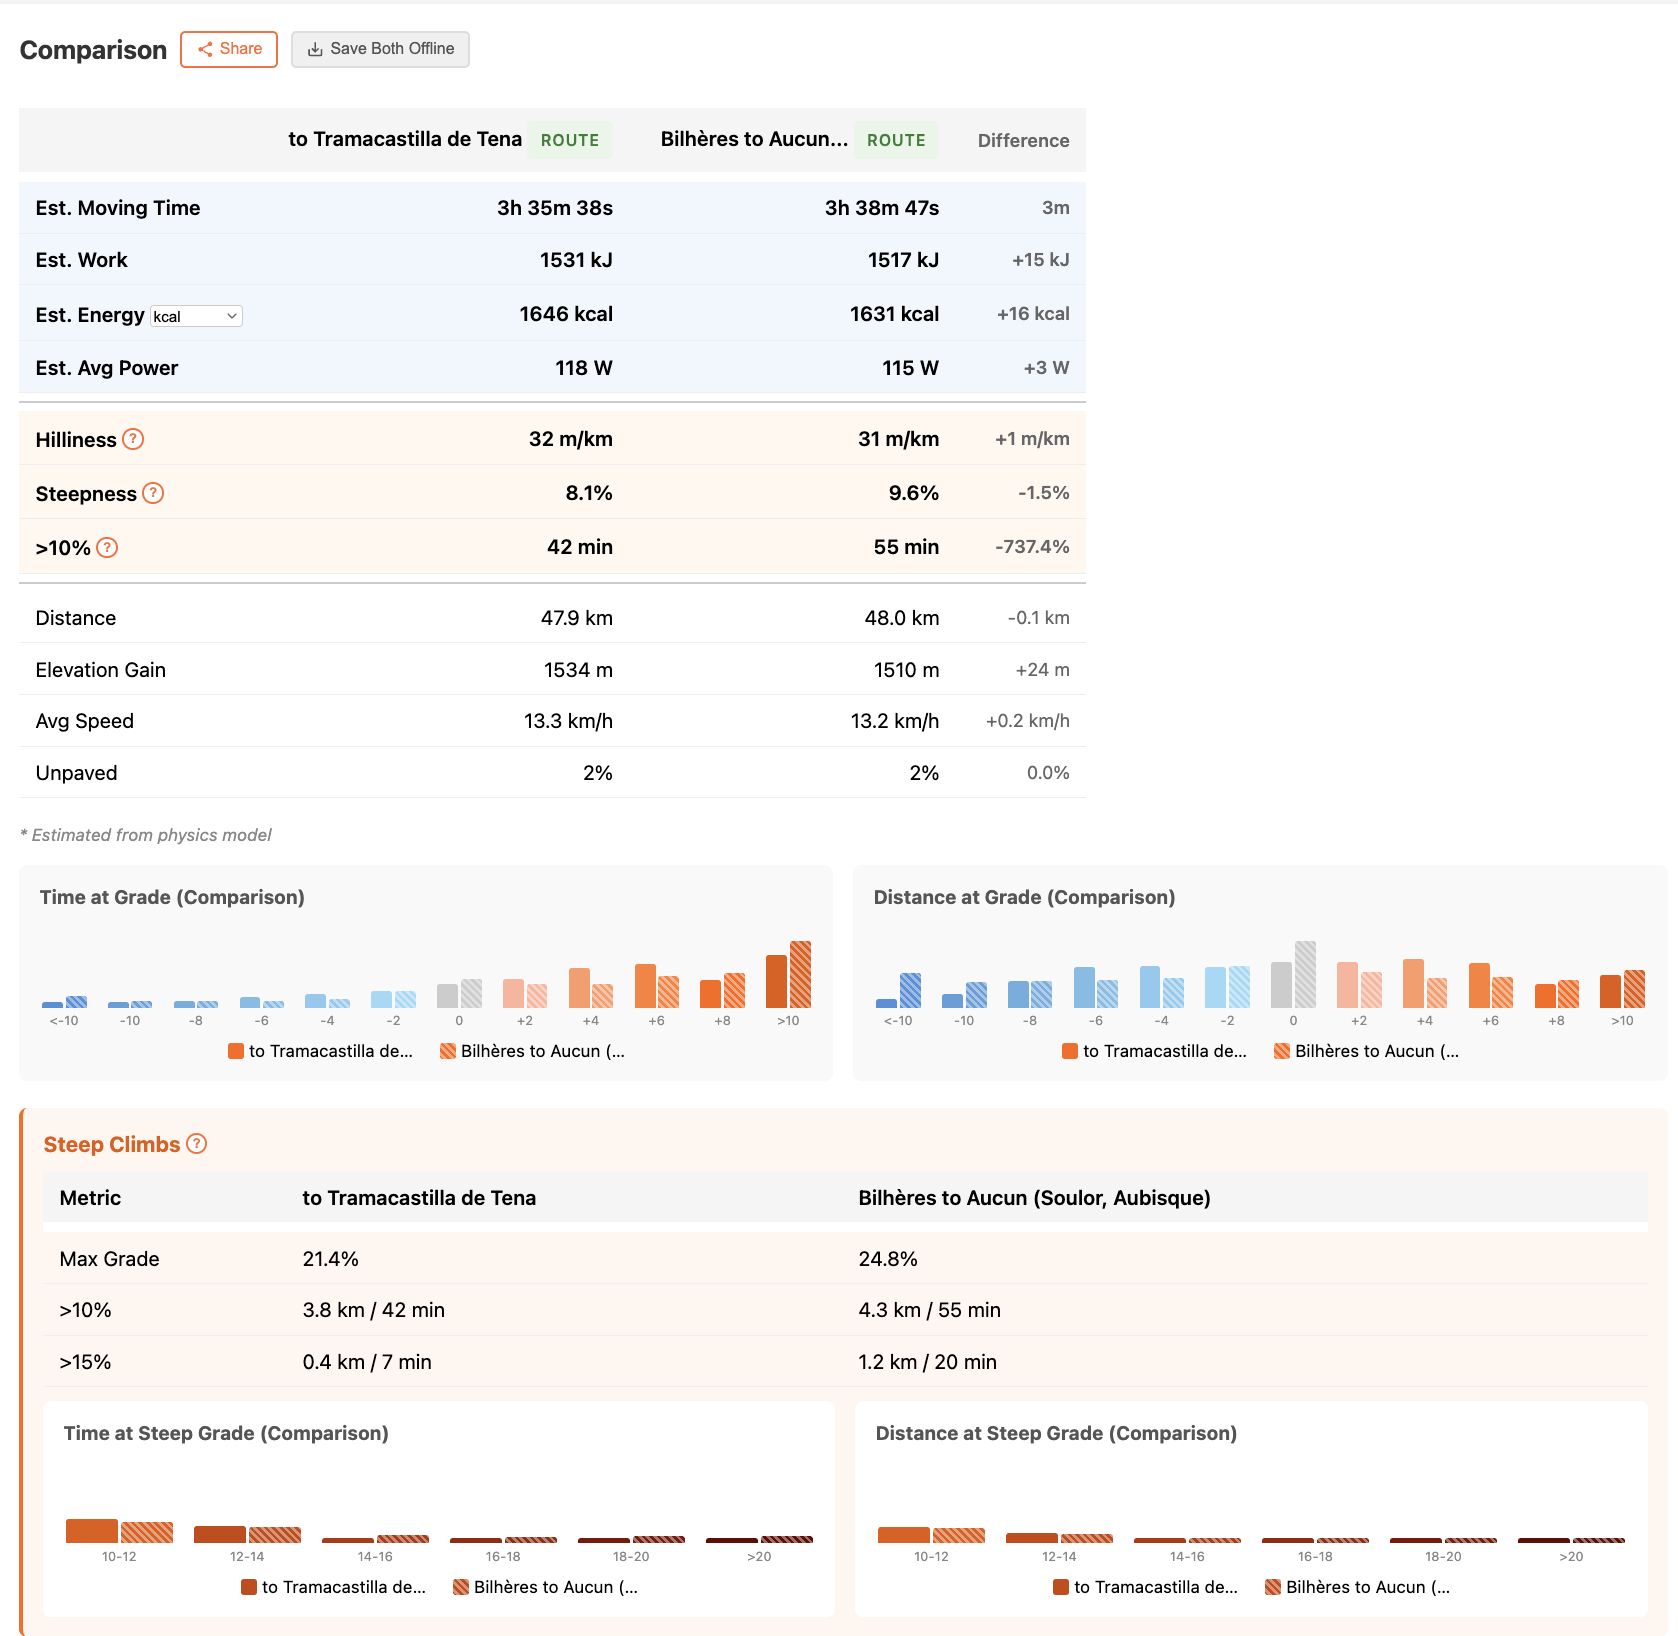
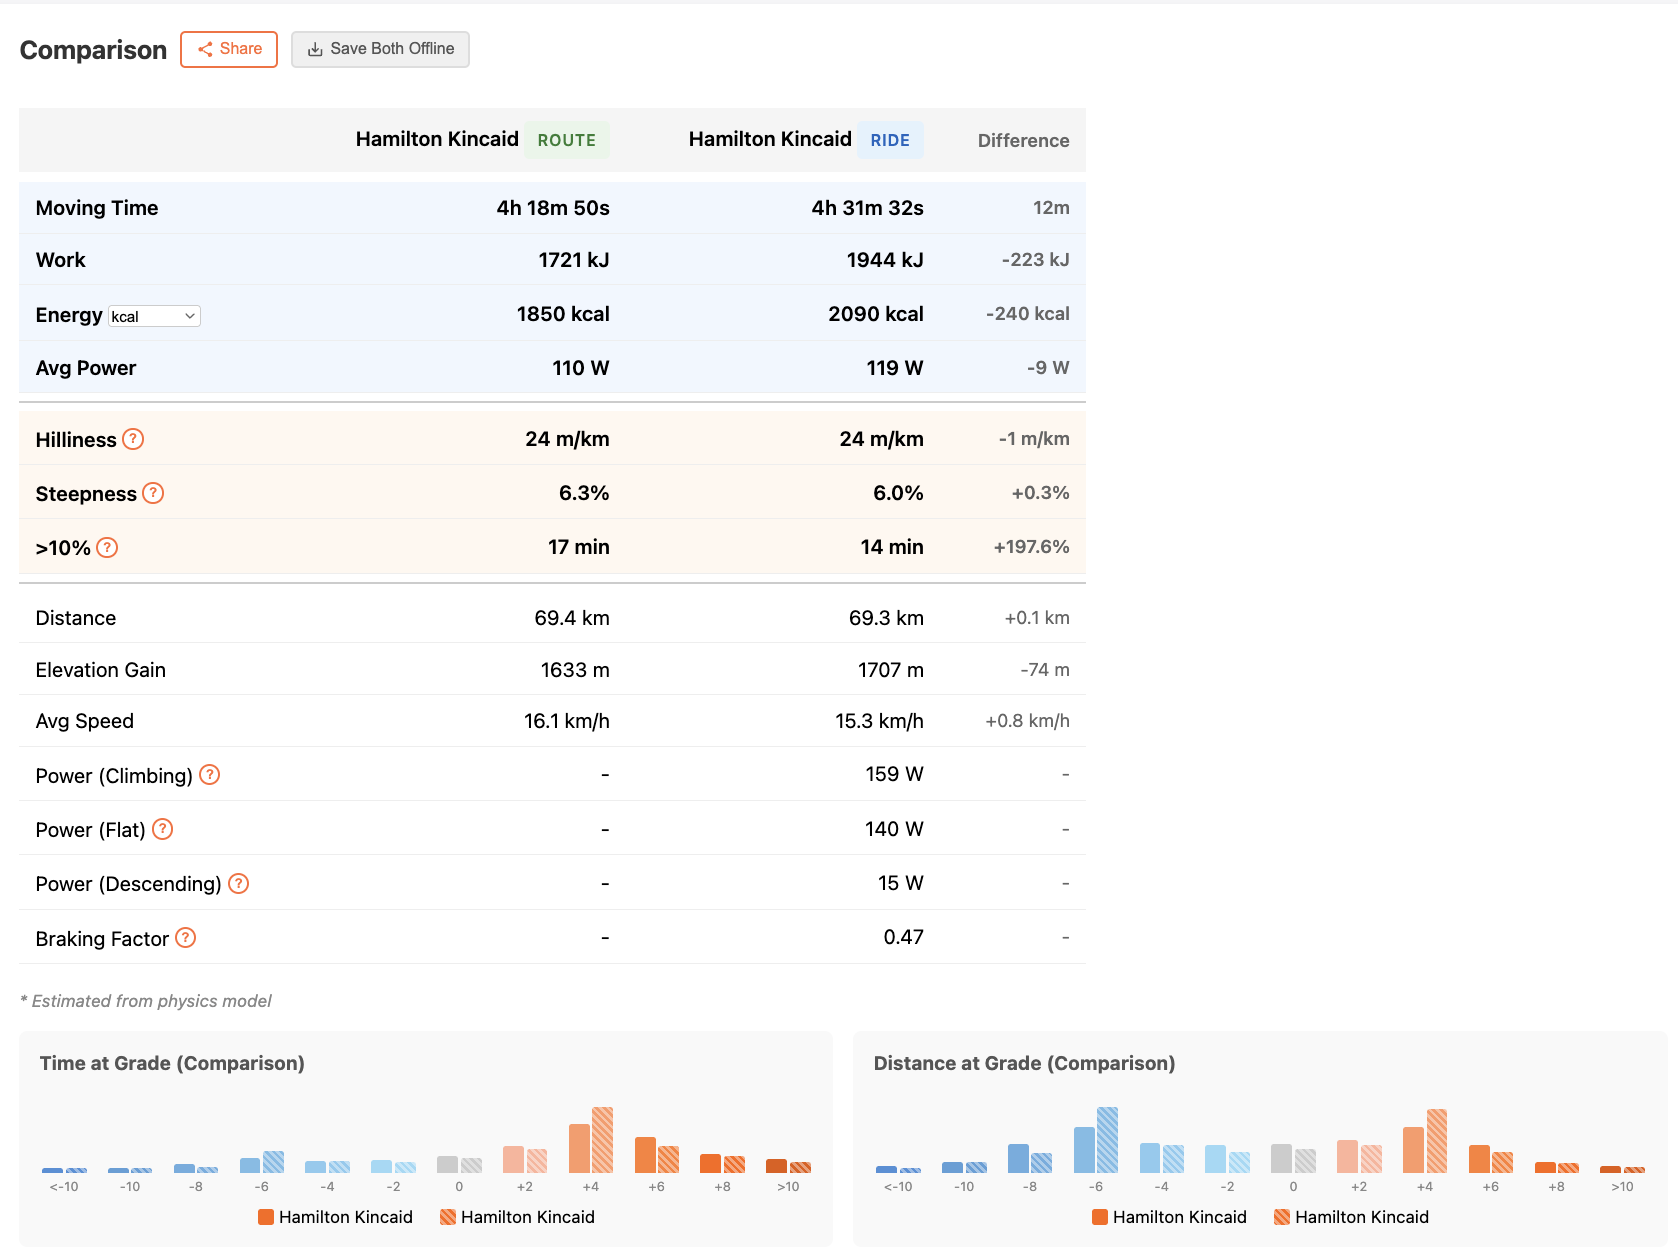
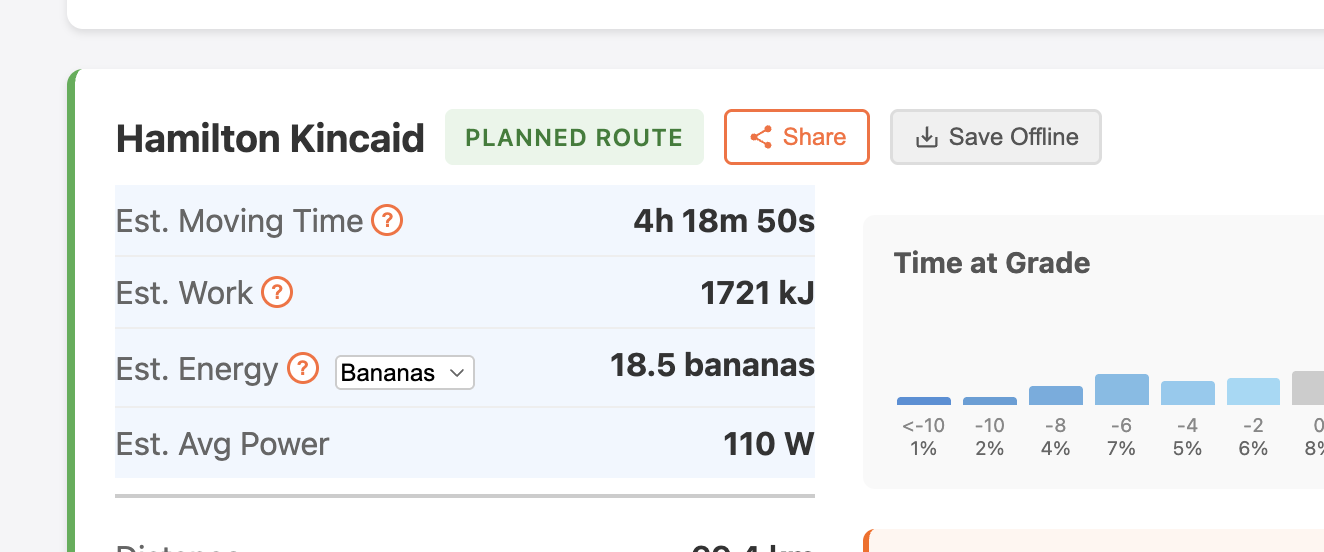
Compare
Two planned routes side by side, or a planned route vs your actual ride. The second one is useful for calibrating power numbers — if the model says 4 hours and you rode 4h30, your climbing power is probably too high.
Examples: Pourtalet vs Aubisque · Mt Hamilton — estimate vs actual
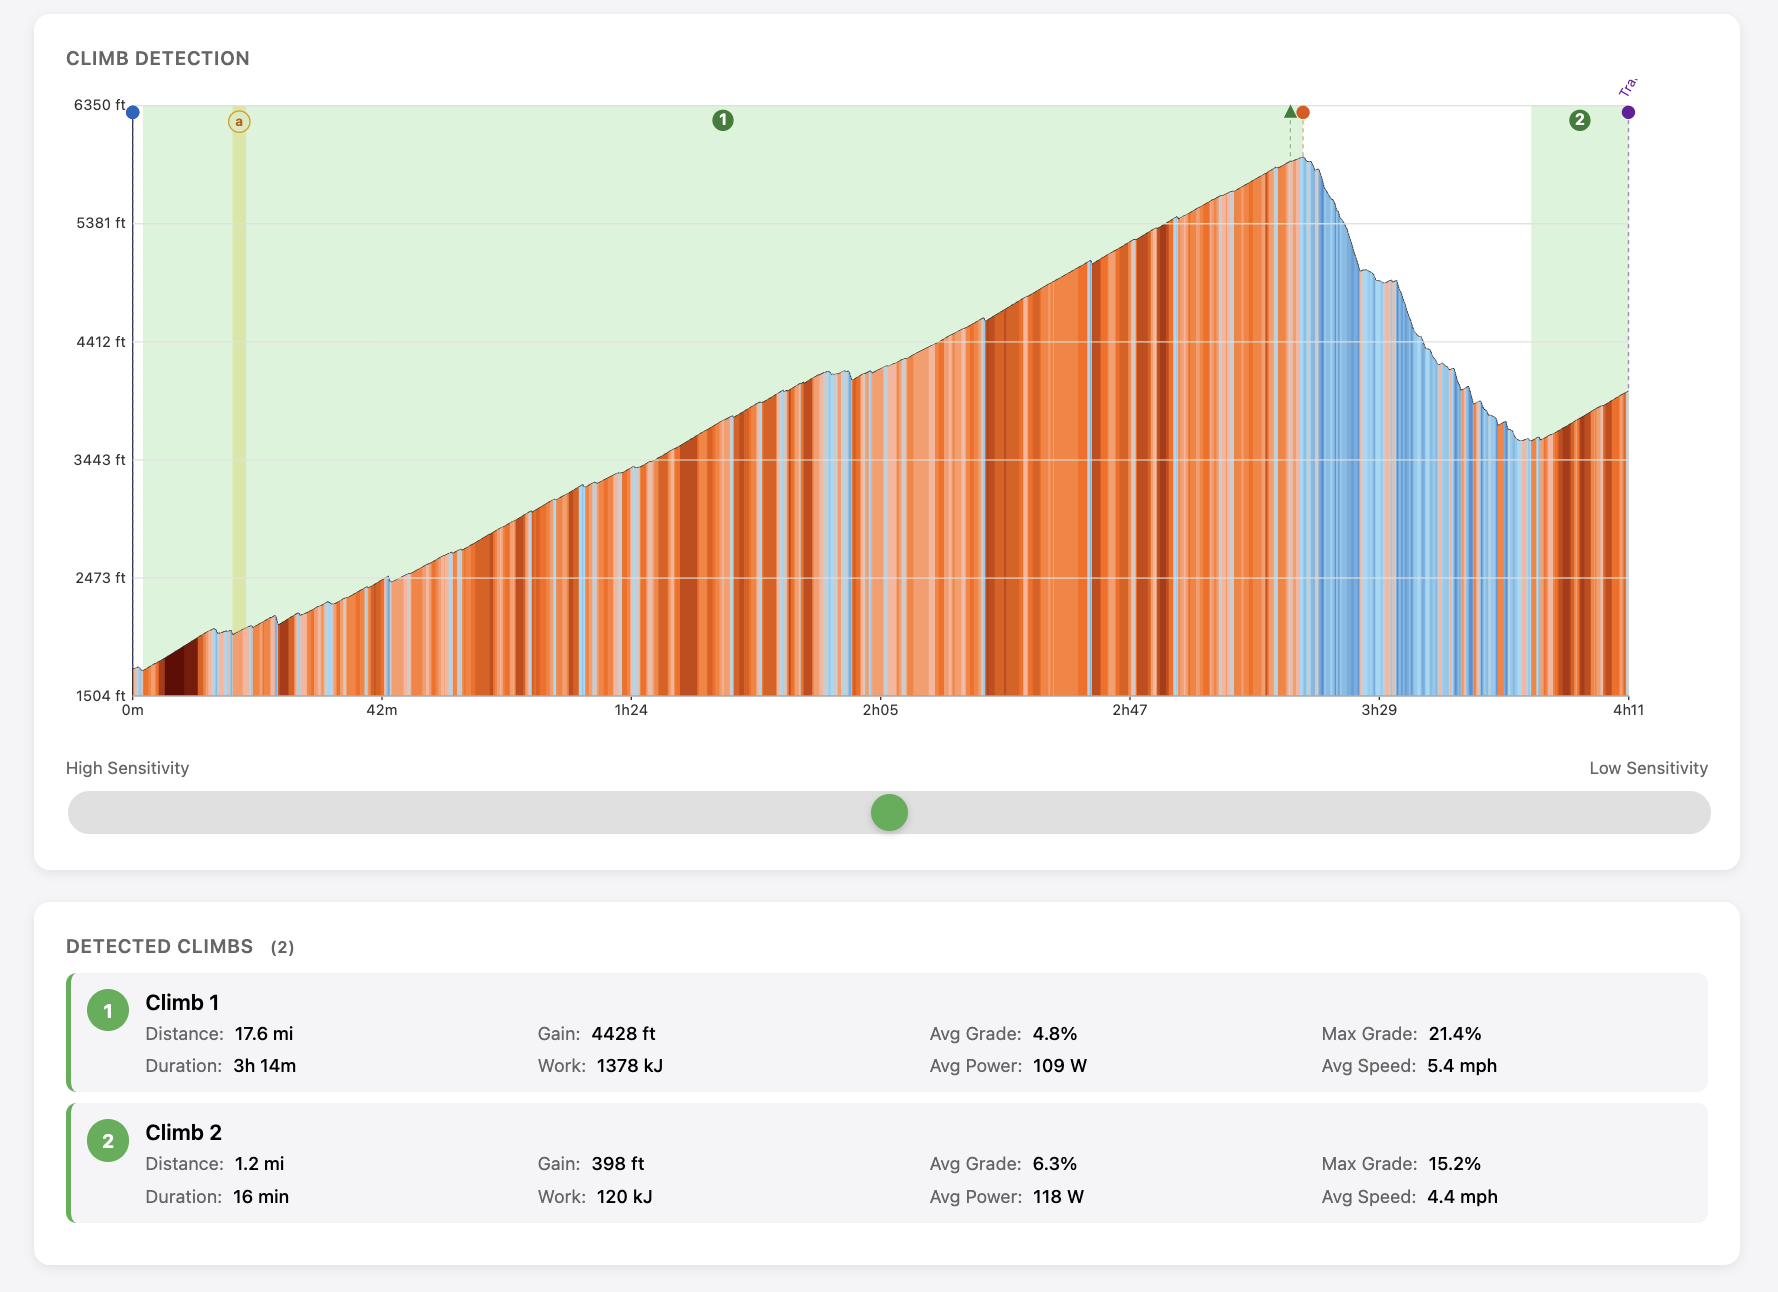
Climb Detection
Automatic climb detection with adjustable sensitivity. Each climb gets distance, gain, average and max grade, estimated work and speed.
Offline
Save any analyzed route for offline access. Elevation profile, stats, climb data — all work without a connection. For when you're in a valley in the Pyrenees with no signal and need to know what's coming next.
Physics Model
Speed is calculated by solving the power balance equation: your power output equals the sum of resistive forces times velocity. All parameters below are tunable and have been calibrated against a training set of planned routes compared with actual ride data.
Primary Parameters (Biggest Impact)
- Climbing Power (W) — Power output on steep climbs. Most important input for hilly routes.
- Flat Power (W) — Power output on flat terrain. Power ramps linearly from flat to climbing power as grade increases.
- Mass (kg) — Total weight of rider + bike + gear. Dominates climbing speed since you're lifting this weight against gravity.
- CdA (m²) — Aerodynamic drag coefficient × frontal area. Controls air resistance, which grows with the cube of speed. Typical values: 0.25 (racing tuck) to 0.45 (upright touring).
- Crr — Rolling resistance coefficient. Energy lost to tire deformation and surface friction. Road tires ~0.004, gravel ~0.008-0.012.
Environmental Factors
- Wind (km/h) — Wind speed and direction. Wind is decomposed per-segment into headwind/tailwind based on route bearing. A 15 km/h headwind at 25 km/h means drag as if riding 40 km/h.
- Air density (kg/m³) — Affects aerodynamic drag. Lower at altitude (1.225 at sea level, ~1.0 at 2000m).
Descent Model
Descent speed is limited by gradient steepness AND road curvature (the more restrictive wins).
Gradient-based:
- Max coasting speed — Speed limit when coasting downhill on paved roads.
- Max coasting speed unpaved — Lower speed limit for gravel/dirt descents.
- Steep descent speed — Even slower limit for very steep descents.
- Steep descent grade — Grade threshold where steep descent speed applies.
- Coasting grade threshold — Grade where you stop pedaling entirely and coast.
- Descent braking factor — Multiplier for descent speeds (1.0 = full physics speed, 0.5 = cautious braking).
- Descent power — Light pedaling power on gentle descents (drops to zero on steep grades).
Curvature-based:
- Straight descent speed — Max speed on straight sections (low curvature).
- Hairpin speed — Max speed through tight switchbacks (high curvature).
Gravel/Unpaved Model
- Surface Crr deltas — Per-surface-type rolling resistance increases based on RideWithGPS surface data. Rougher surfaces get higher Crr.
- Gravel power factor — Multiplier on power for unpaved surfaces (default 0.90 = 10% reduction). Models traction limits, vibration fatigue, and seated climbing on rough terrain.
- Max coasting speed unpaved — Lower descent speed limit on gravel/dirt roads.
Gravel sections are shown as brown strips on the elevation profile when "Show gravel" is toggled.
Data Processing
- Smoothing radius (m) — Gaussian smoothing applied to elevation data. Reduces GPS noise and unrealistic grade spikes while preserving overall climb profile.
- Elevation scale — Multiplier applied after smoothing. Auto-calculated from RideWithGPS API (DEM-corrected) elevation when available.
- Anomaly detection — Automatic detection of elevation anomalies: (1) spikes from DEM artifacts like tunnels or bridges where elevation shows the surface above rather than the actual path, and (2) dropouts from GPS/sensor errors where elevation briefly drops to zero or unrealistic values. Both are corrected by linear interpolation and highlighted with yellow bands in the elevation profile.
Climate Data
Climate statistics are derived from historical weather records so you can see what conditions are typical for a location in a given month.
Pre-computed ERA5-Land Data
For supported regions, climate data is pre-computed from the ERA5-Land reanalysis dataset — up to 30 years of daily records on a 0.1° grid (~9 km). Temperature uses a 15-year window (more predictive of current climate), while precipitation and snow use the full 30-year record for statistical reliability. Wind data comes from the coarser ERA5 reanalysis (0.25° grid) and is shown as a wind rose with speed and direction distributions.
Open-Meteo Fallback
For locations outside pre-computed regions, the app falls back to the Open-Meteo Historical Weather API, which provides similar data from ERA5 reanalysis. Results are comparable but may differ slightly due to different interpolation methods and grid resolutions.
Coverage
Pre-computed coverage currently includes Western Europe, parts of North America, and other popular cycling regions. Coverage is expanding over time as new areas are processed. When you view climate data, the source (precomputed vs open-meteo) is shown so you know which pipeline produced the numbers.
Back Story
My wife and I did a self-supported tour through mountains in another country. I planned most of the routes myself using RideWithGPS and Komoot, but I underestimated the difficulty. By the end of the first week we were deep in a deficit and more tired than we wanted to be.
For our next tour I wanted to know how hard each day would actually be — not just distance and elevation, but time on the bike, energy cost, and what the weather is usually like in that place in that month. I also wanted to compare unfamiliar routes with ones we've already done and know how they feel. So I made an app for that.
In building it, I realized you can't just assign a single "difficulty score" to a route — there are too many ways to evaluate difficulty. Instead I rate routes on a few key characteristics: total work, moving time, hilliness, and time spent above 10% grade.
I've tried to keep it lightweight so it doesn't cost much to operate. I don't intend to charge for it. If it helps other people who, like me, enjoy planning their own cycling adventures in places they've never been — that's enough.
Open-Meteo vs ERA5
When you view climate data, the source is shown as either "precomputed" or "open-meteo." Precomputed data comes from ERA5-Land files that have been downloaded and processed in advance — it's fast and consistent. Open-Meteo data is fetched on-demand from the Open-Meteo API, which itself draws from ERA5 reanalysis. Both are based on the same underlying dataset, but results can differ slightly due to different spatial interpolation, grid resolution (0.1° vs ~0.25°), and processing methods.
Accuracy & Limitations
The physics model produces estimates, not measurements. It has been calibrated against real rides but it is not a power meter. Factors like wind, fatigue, navigation, traffic, and variable effort mean actual ride times will differ. Climate percentiles are based on historical records — they describe what has typically happened, not what will happen on your specific day.
Data Attribution
Route and surface data from RideWithGPS. Climate data from Open-Meteo (CC BY 4.0). Contains modified Copernicus Climate Change Service information via ERA5-Land (CC BY 4.0). Geocoding and map tiles by OpenStreetMap contributors. Gravel classification follows the Industry Standard Guide to Gravel.